
Turn a Topical Authority Map Into a Daily Publishing Engine
A topical authority map is a visual graph of everything your site covers, or should cover, inside a topic. It shows entities as nodes, relationships as edges, and coverage gaps as color, so you can see instantly what to publish next. The primary use of this graph is diagnostic: it exposes the highest-impact gaps before you write a single word. Every technique below builds toward one thing: a reproducible workflow that turns the map into an actual publishing queue.
TL;DR:
- A topical authority map visually identifies high-impact content gaps, structural issues, and potential link opportunities by highlighting uncovered nodes and bridges between clusters.
- Building a map from a single cluster involves defining scope, collecting data from multiple sources, creating a co-occurrence matrix, and manually verifying cluster groupings to ensure accuracy.
- Prioritization of gaps combines signals like centrality, coverage, traffic potential, and business relevance, with high centrality uncovered nodes and bridge pages ranking highest for immediate action.
- Updating the map quarterly or after significant SERP or traffic changes maintains its accuracy, ensuring teams target relevant gaps and avoid chasing outdated opportunities.
- Automating continuous data collection and leveraging tools like Ranksector can scale topical mapping across multiple clusters, enabling daily publishing and ongoing content optimization.
Table of Contents
- What Does a Topical Authority Map Actually Show You?
- Why Topical Authority Maps Matter for Content Planning
- How to Build a Topical Authority Map From a Seed Keyword
- Which Tools and Templates Actually Work for This?
- How Do You Prioritize Nodes Into a Publishing Roadmap?
- How Often Should You Update a Topical Authority Map?
- How Ranksector Runs Topical Maps at Publishing Scale
- The Mistakes That Waste Everyone’s Time
- Turn Your Map Into a Daily Publishing Habit
- Sources
- FAQ
What Does a Topical Authority Map Actually Show You?
Reading a map is different from building one, and most teams skip straight to tools without learning the visual language first. Each node represents an entity or subtopic; edges represent co-occurrence or semantic proximity between them. Node size usually maps to centrality, meaning how connected a topic is to the rest of the cluster. Color tells you coverage status: covered, partially covered, or untouched.
The most valuable nodes are often not the biggest ones. Bridges, the edges that connect two otherwise separate clusters, mark high-value pages because they capture traffic and citations from both sides of the topic. A topical map built from a crawl can also flag structural problems directly on the graph:
- Orphan pages with no inbound internal links
- Thin clusters where coverage exists but depth doesn’t
- Bridge opportunities where no page currently exists
Most tools export the same three formats: a force-directed visual graph for pattern spotting, a CSV for filtering and sorting, and a spreadsheet with fields ready for editorial use.
Why Topical Authority Maps Matter for Content Planning
Guessing what to publish next is expensive. A map replaces that guesswork with a ranked list of gaps, sorted by how much they matter to the cluster and to your business. That single shift changes three things in a content operation:
- Internal linking gets clearer because bridges show you exactly where a link should exist but doesn’t
- AI answer engines cite pages that sit at high-centrality nodes, so mapping those nodes first improves citation odds
- Brief creation speeds up because the map already tells you the entities a new page needs to cover
Teams that treat a gray, uncovered core node as their next pillar page tend to see internal link flow improve almost immediately, since every related cluster page can now point somewhere solid.
How to Build a Topical Authority Map From a Seed Keyword
Building your first map takes a few hours, not weeks, if you scope it correctly from the start.
- Pick one cluster, not the whole niche. A single cluster map connected by bridges scales better than a giant map trying to hold an entire subject.
- Set your seed topic and boundary. Decide what counts as “in cluster” and what belongs to a neighboring map instead.
- Pull your data sources. Combine keyword tool exports, SERP entity extraction, Google Search Console queries, a full site crawl, and TF-IDF pulls from competitor titles and headings.
- Build a co-occurrence matrix. List entities down one axis and pages or queries across the other, then mark where they overlap. A spreadsheet handles this fine for smaller clusters.
- Cluster and measure centrality. Group tightly linked entities together, then flag which nodes connect to the most neighbors. Those are your priority candidates.
- Color by coverage. Mark each node covered, partial, or uncovered against your current site content, and flag orphan pages while you’re in there.
- Export the work items. Every node that needs action should leave the map as a row with a title, search intent, target entities, and suggested internal links.
Pro Tip: Don’t trust automated clustering blindly. Run the algorithm, then spend twenty minutes manually checking entity labels and bridge candidates, since clustering tools frequently misgroup near-synonyms that a human catches instantly.
Which Tools and Templates Actually Work for This?
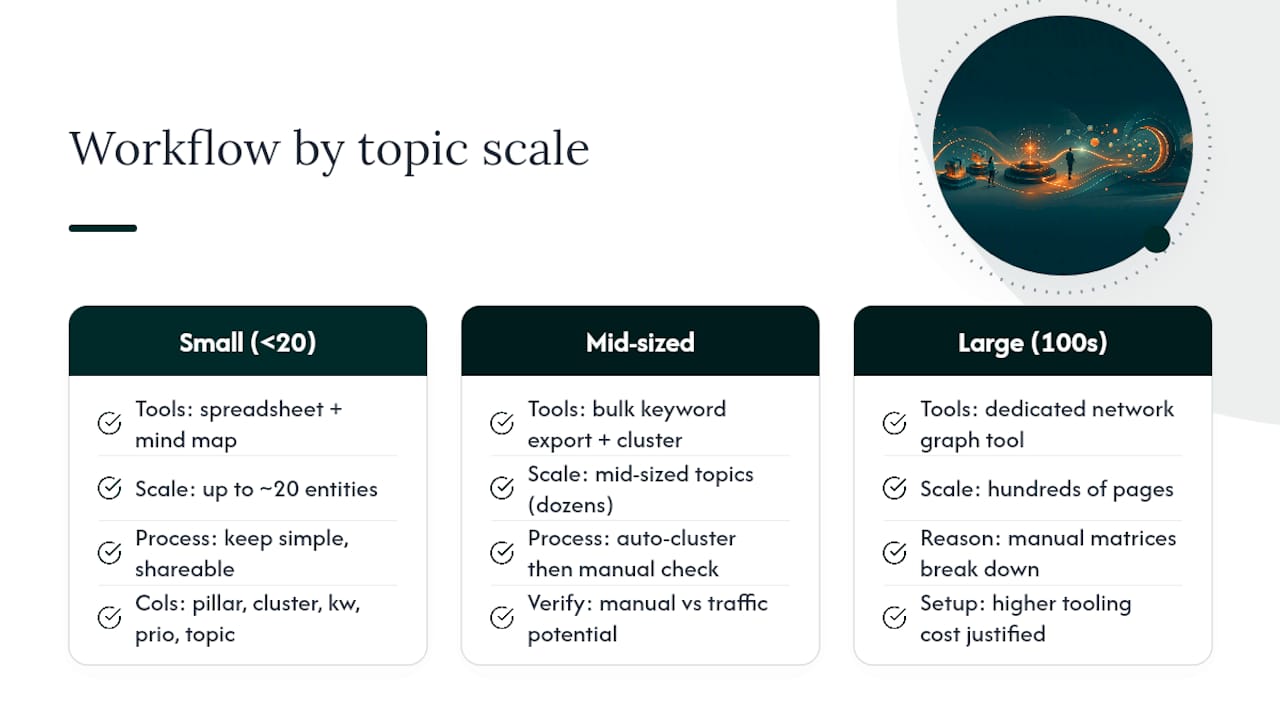
The right workflow depends entirely on scale, and the mistake most teams make is reaching for a graph tool when a spreadsheet would do the job faster.
For clusters under roughly 20 entities, a spreadsheet paired with a simple mind map is genuinely sufficient. Your columns should include pillar, cluster, keyword, priority, topic, and reasoning, which keeps the document usable by anyone on the editorial team, not just the person who built it.
For mid-sized topics, export keywords in bulk, run them through keyword clustering, then manually verify each cluster against actual traffic potential before it earns a spot on the map.
For sites with hundreds of pages, a dedicated network graph tool becomes worth the setup cost, since manual co-occurrence matrices break down past a certain node count. Whatever the scale, keep your export fields consistent: title, intent, top entities, and mapped URL, so briefs generate cleanly every time.
How Do You Prioritize Nodes Into a Publishing Roadmap?
A map with fifty flagged gaps is useless without a way to rank them. The strongest scoring approach combines four signals: centrality (how connected the node is), coverage gap (how uncovered it is), traffic potential, and business relevance. Ahrefs’ guidance on topical mapping backs this directly, recommending brand relevance and business potential alongside traffic rather than ranking by search volume alone.
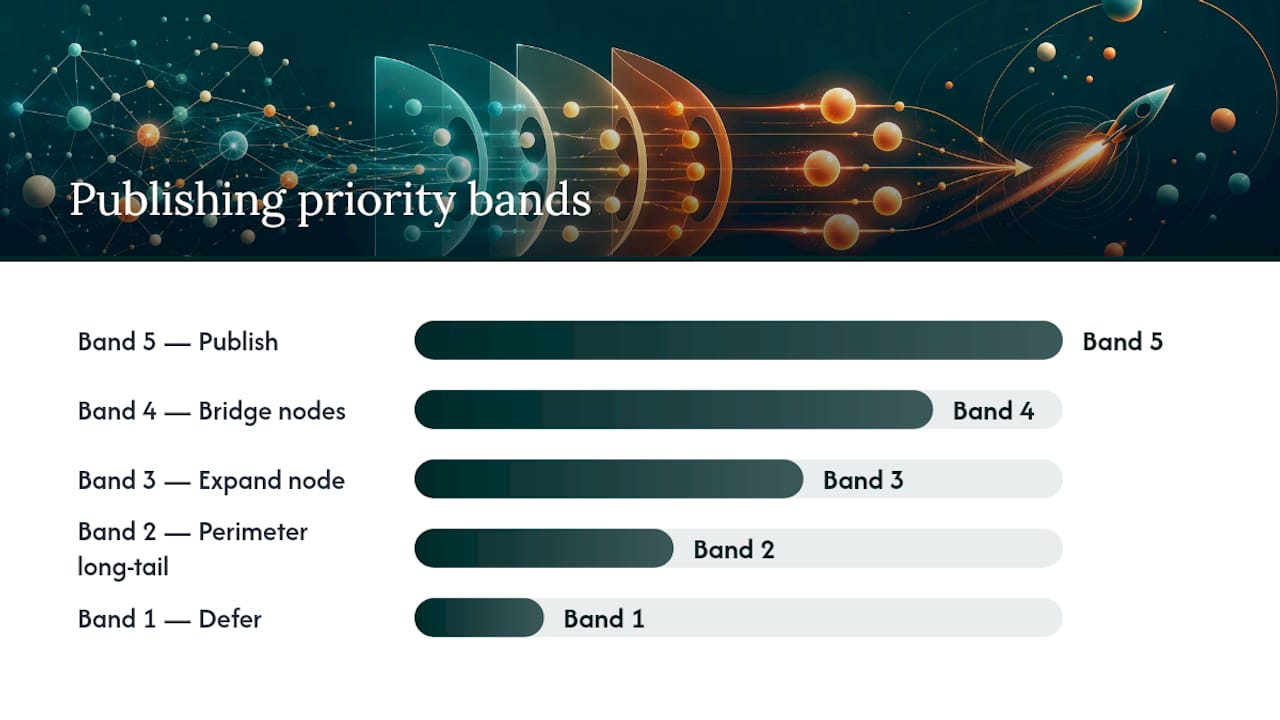
A simple five-band system works well in practice:
- Band 5: High centrality, uncovered, high business relevance, publish first
- Band 4: Bridge nodes connecting two clusters with no current page
- Band 3: Partial coverage on a high-traffic node, needs expansion not creation
- Band 2: Perimeter long-tail topics with moderate traffic potential
- Band 1: Low-centrality, low-relevance nodes, defer indefinitely
Work grey-core uncovered nodes first, move to bridges next, and save perimeter long-tail pages for whenever the queue runs dry.
How Often Should You Update a Topical Authority Map?
A map goes stale the moment you stop touching it, and stale maps send teams chasing gaps that no longer exist.
- Set a quarterly minimum. Topical maps are living documents that need review at least every quarter, more often if you’re publishing weekly.
- Watch for triggers between reviews. A new product launch, a sudden SERP reshuffle, or analytics showing a page decaying all justify an off-cycle refresh.
- Run the same three checks every time. Re-pull your data sources, recolor nodes for coverage, and reorder the priority queue based on what changed.
How Ranksector Runs Topical Maps at Publishing Scale
Manual map building works well for a single cluster. It breaks down fast once you’re managing ten clusters across a growing site, which is exactly the resource gap most small teams hit.
Ranksector builds its keyword research on competitor and market analysis, which functions as an automated version of the same coverage mapping described above, run continuously instead of quarterly. That data can feed directly into daily article briefs, so the highest priority gaps get filled without a person manually reordering a spreadsheet every Monday. A few things worth knowing about how this plays out operationally:
- Automation handles volume and consistency; a human still needs to sanity check entity labels the way any map-building process requires
- A backlink exchange network can compound the effect by growing domain authority alongside the content itself
- Daily publication can work because the underlying map, not a content calendar, decides what gets written
The Mistakes That Waste Everyone’s Time
The biggest mistake I see is mapping an entire niche before writing anything, which produces a graph too large to act on. Second is trusting search volume as the only priority signal, ignoring business relevance entirely. Third is ignoring bridges altogether, missing the exact pages most likely to earn citations from both sides of a cluster.
Start with one cluster. Rank grey-core nodes first. Automate your exports into whatever project tool your team already uses. If you do only those three things, the map earns its place in your workflow.
— Savannah
Turn Your Map Into a Daily Publishing Habit
A map tells you what to write. Some platforms offer alternatives to hiring a full content team for the execution part, turning a prioritized node list into daily, published articles without adding headcount. Where a manual workflow gets you a ranked spreadsheet once a quarter, Ranksector’s AI audit tool evaluates your topical coverage on an ongoing basis and feeds the gaps straight into a publishing queue.
If your team has the map but not the hours to act on it, that’s the exact gap Ranksector exists to close. Teams evaluating a managed setup instead of building everything in-house can check the agency-focused plan for how briefs, publishing, and backlink exchange work together. Start with the free tools to see what a coverage audit surfaces on your own site before committing to anything.
Sources
- Topical Authority Map: See Your Content Strategy as a Graph
- How to Build an SEO Topical Map (With Template)
- Topical Authority Map | Free SEO Tool | Jesse Johnson
- Building The Topical Keyword Map | Content RevOps
FAQ
What Are Topical Maps?
A topical map is a visual or spreadsheet representation of the subtopics, entities, and pages within a subject, showing what’s covered and what’s missing so teams can plan content with intent rather than guesswork.
How Do You Create a Topical Map?
Pick one cluster, pull data from keyword exports, SERP entities, and a site crawl, build a co-occurrence matrix, cluster it by centrality, and color each node for coverage before exporting the gaps as work items.
Are Sitemaps Still Used?
Yes, but they serve a different job. A sitemap lists your pages for crawlers; a topical authority map shows relationships and gaps between subjects, making it a planning tool rather than an indexing file.
What Does “Map” Mean in Marketing?
In content marketing, a map is a visual or tabular plan showing topic coverage, priority, and relationships, most often used to decide what content to create next and where internal links should point.
How Often Should a Topical Authority Map Be Updated?
Update it at least quarterly, and sooner after a major SERP shift, a new product launch, or analytics data showing existing pages losing traffic.