
Why Page Speed Affects Rankings: 2026 SEO Guide
Page speed is a confirmed Google ranking factor, and recently it has become more significant for rankings. The March 2026 core update tightened Core Web Vitals thresholds and elevated Interaction to Next Paint (INP) as a primary ranking signal alongside Largest Contentful Paint (LCP). But here is the part most SEO guides get wrong: speed does not work like content or backlinks. It functions as a gatekeeper and a tiebreaker. When two pages match on relevance and authority, the faster one wins. A blazing-fast page with thin content will not outrank a well-linked, authoritative page that loads quickly enough.
Google measures page speed through real user data collected by the Chrome User Experience Report (CrUX) over a rolling 28-day window, evaluated at the 75th percentile. That means your Lighthouse score is a diagnostic tool, not a ranking signal. The field data section in Google PageSpeed Insights is what actually matters for search rankings.
Key mechanics to understand before going deeper:
- Page speed as a tiebreaker: Failing Core Web Vitals thresholds adds a negative signal; passing removes the penalty; going beyond “good” produces no measurable ranking boost.
- Core Web Vitals metrics: LCP (loading speed), INP (interactivity), and CLS (visual stability) are the three signals Google uses.
- Field data over lab scores: Google ranks pages based on CrUX field data, not Lighthouse lab scores.
- Mobile and desktop evaluated separately: Mobile performance carries more weight due to mobile-first indexing, and most searches happen on mobile.
- Indirect ranking effects: Slow pages drive higher bounce rates and lower dwell time, feeding negative behavioral signals into Google’s ranking systems.
How Google PageSpeed Insights and Core Web Vitals actually measure your site
Google gives you two distinct tools for evaluating page speed, and confusing them is one of the most common mistakes SEO professionals make. Google PageSpeed Insights combines two fundamentally different data sources: a Lighthouse lab score at the top and CrUX field data below it. The big number most people focus on is the Lighthouse score. That number does not influence your rankings.
Google uses CrUX field data for ranking decisions, not lab scores. Lighthouse runs a single synthetic page load under throttled conditions with no cached data and no browser extensions. CrUX aggregates real performance data from Chrome users visiting your site on their actual devices, with their actual network connections, over 28 days. A site can score 37 on Lighthouse and pass all three Core Web Vitals in the field. Conversely, a site can score 90 on Lighthouse and fail CrUX if real users trigger layout shifts that the lab never simulates.
Google evaluates your Core Web Vitals at the 75th percentile of CrUX data, meaning 75% of real users on your site must hit the “good” threshold for each metric. That 25% buffer sounds generous, but a small cluster of very slow users can drag your score below the threshold.

Core Web Vitals thresholds after the March 2026 update:
| Metric | Good | Needs Improvement | Poor |
|---|---|---|---|
| LCP (Largest Contentful Paint) | Good | Needs improvement | Poor |
| Metric | Good | Needs Improvement | Poor |
| — | — | — | — |
| LCP (Largest Contentful Paint) | ≤ 2.5s | 2.5–4s | > 4s |
| INP (Interaction to Next Paint) | ≤ 200ms | 200–500ms | > 500ms |
| CLS (Cumulative Layout Shift) | ≤ 0.1 | 0.1–0.25 | > 0.25 |
A few things worth knowing about each metric:
- LCP measures how long it takes for the largest visible element to render, usually a hero image or a large heading. It has the strongest observed correlation with ranking position of the three metrics.
- INP replaced First Input Delay (FID) in March 2024. Unlike FID, which only measured the first click, INP measures every interaction during a full user session. It is the hardest metric to fix because it typically requires JavaScript architecture changes.
- CLS measures how much the page visually shifts while loading. Common culprits include images without set dimensions, late-loading fonts, and consent pop-ups that push content around.
Pro Tip: Stop reporting on your Lighthouse Performance score as an SEO KPI. Open Google Search Console, navigate to the Core Web Vitals report, and use that field data instead. That is the data Google uses for rankings.
One more detail that catches site owners off guard: if a specific URL lacks sufficient CrUX data, Google falls back to origin-level scores for the entire domain. Slow high-traffic pages can drag down rankings for low-traffic pages across your whole site.
Why mobile page speed carries more SEO weight than desktop
Google adopted mobile-first indexing for all sites in 2019. That means the mobile version of your page is the primary version Google evaluates for every ranking, including desktop results. Most searches happen on mobile devices. If your mobile page is slow, your rankings suffer everywhere, not just on phones.
Google evaluates mobile and desktop Core Web Vitals separately. A site can pass on desktop and fail on mobile, or vice versa. Since most sites perform worse on mobile due to network variability and device limitations, the ranking impact of failing Core Web Vitals tends to be larger on mobile. You need to track and fix both independently, but mobile is where to start.
Why mobile is harder to pass:
- Network conditions vary widely. Real mobile users connect over 4G, LTE, and sometimes 3G, not the fiber connection your desktop test assumes.
- Device processing power is lower. Heavy JavaScript that runs fine on a desktop CPU causes INP failures on mid-range Android phones.
- INP pass rates are lower on mobile. According to the 2024 Web Almanac, 67% of mobile origins pass INP, though the pass rate is lower than on desktop.
- LCP images are often larger relative to viewport. Hero images that look fine on desktop can dominate the mobile viewport and delay LCP significantly.
The practical implication: run your Core Web Vitals audit on mobile first. Fix mobile failures before touching desktop. Use Google Search Console’s Core Web Vitals report filtered by device type to see exactly where you stand. Tools like WebPageTest let you simulate real mobile network conditions and device profiles, giving you a clearer picture than a desktop lab test ever will.
Pro Tip: When auditing mobile speed, test on a mid-range Android device profile rather than a high-end iPhone. Google’s CrUX data skews toward the full range of real-world devices, and a mid-range Android often reveals failures that a flagship phone hides.
How page speed affects user experience, engagement, and conversions
Page speed’s influence on rankings goes well beyond the direct Core Web Vitals signal. Slow pages drive users away before Google’s behavioral signals even register a session. Google’s own research found that 53% of mobile site visits are abandoned if the page takes longer than 3 seconds to load. That abandonment rate feeds directly into bounce rate and dwell time metrics, which are behavioral signals that reinforce ranking strength independently of Core Web Vitals.

The connection between speed and conversions is equally direct. Research consistently shows that each 100ms improvement in load time correlates with roughly a 1% lift in conversion rates. Yelp reported a 15% lift in conversions after improving their page speed. Vodafone Italy improved LCP by 31% and saw 8% more sales. These are not marginal gains.
Speed improvements also affect crawl efficiency. Googlebot allocates crawl budget based on server response times. Slow sites get crawled less frequently, which means new content takes longer to appear in search results. Fast sites get indexed more often, giving fresh content a visibility advantage.
Key behavioral and business impacts of page speed:
- Bounce rate: Pages that load slowly see higher abandonment, which signals low quality to Google’s ranking systems.
- Dwell time: Faster pages keep users engaged longer, producing stronger session quality signals.
- Conversion rate: Speed improvements deliver measurable revenue gains, often more tangibly than the direct SEO ranking benefit.
- Crawl frequency: Faster server response times lead to more frequent Googlebot visits and quicker indexing of new content.
- AI Overview eligibility: Fast, well-structured pages are more likely to be selected as AI Overview sources, since slow or unstable pages create friction for Google’s automated crawlers.
A study of 7 million web sessions found a moderate negative correlation between CLS and engagement rate (r = -0.470). Pages with lower CLS had higher engagement, and engagement metrics feed into Google’s ranking signals independently of Core Web Vitals.
The business case for speed optimization is often stronger on the conversion side than the SEO side. If you need to justify the engineering investment to a CFO, lead with the revenue impact of faster load times, not the ranking signal. The SEO benefit is real but modest. The conversion impact is where the ROI case is clearest.
Practical ways to improve your page speed for SEO
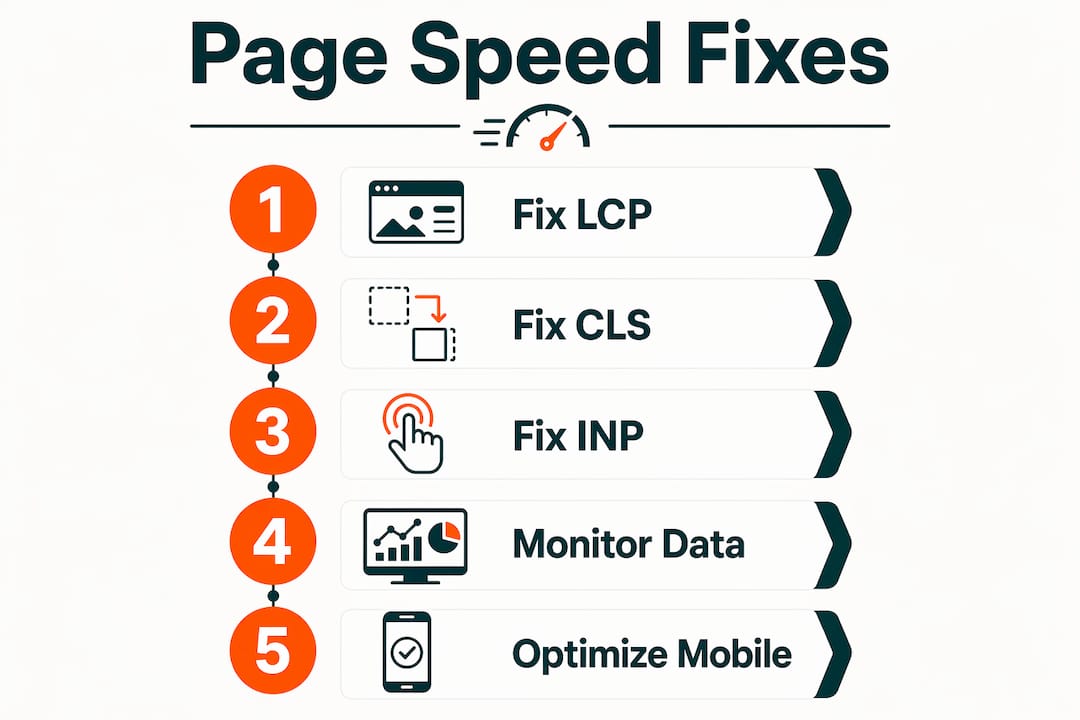
Fixing page speed is not about chasing a perfect Lighthouse score. The goal is getting all three Core Web Vitals metrics into the “good” threshold in your CrUX field data. Here is how to approach each metric systematically, starting with the highest-impact fixes.
Fix LCP first
LCP has the strongest observed correlation with ranking position of the three Core Web Vitals. The most common cause of LCP failure is also the most avoidable: applying loading="lazy" to the hero image. Lazy loading hides the image from the browser’s preload scanner and delays discovery by hundreds of milliseconds. Remove lazy loading from your LCP image and add fetchpriority="high" instead.
Other high-impact LCP fixes:
- Compress and size images correctly. Use modern formats like WebP or AVIF. Serve images at the dimensions they actually display, not at 2x or 3x the rendered size.
- Reduce server response time (TTFB). A Time to First Byte above 800ms delays everything downstream. Upgrade hosting, use a Content Delivery Network (CDN), or enable server-side caching.
- Eliminate render-blocking CSS and JavaScript in the
<head>. Defer non-critical scripts and inline only the CSS needed for above-the-fold content. - Preload the LCP resource. Add a
<link rel="preload">tag for your hero image so the browser discovers it immediately, before parsing the full HTML.
Fix CLS second
CLS has the strongest correlation with user engagement of the three metrics, and common CLS problems are usually front-end issues that do not require architectural changes. Set explicit width and height attributes on all images and videos. Use CSS aspect-ratio for responsive containers so the browser reserves space before the image loads. Preload custom fonts and set font-display: swap to prevent invisible text causing layout shifts. Reserve space for dynamically injected content like ads or consent banners before they load.
Fix INP last, but plan for it
INP is the hardest metric to fix because it requires changes to how JavaScript executes, not just how assets load. Break up long JavaScript tasks that block the browser’s main thread into smaller chunks using techniques like setTimeout or the Scheduler API. Optimize event handlers so they respond quickly to user input. Reduce third-party script load, since tag managers, analytics platforms, and ad scripts can easily accumulate 1–2MB of JavaScript executing during page load.
Ongoing monitoring and infrastructure
- Use Google Search Console’s Core Web Vitals report monthly. This is the field data Google uses for rankings. If all three metrics show “Good” here, your page experience is not hurting your SEO.
- Use WebPageTest for deep diagnostic testing. It lets you simulate real mobile network conditions and device profiles, and it shows waterfall charts that reveal exactly which resources are blocking LCP.
- Deploy a CDN to reduce geographic latency for repeat visitors. CDNs cache static assets on servers closer to users, cutting load times for visitors far from your origin server.
- Enable browser caching so returning visitors load pages faster. This improves Core Web Vitals scores for repeat sessions and reduces server load simultaneously.
- Prioritize fixes by CrUX impact, not Lighthouse score. A fix that moves your field data from “Poor” to “Good” on LCP is worth more than one that pushes your Lighthouse score from 72 to 85.
For a broader view of how technical SEO performance fits into Google’s overall ranking systems, the relationship between speed, authority, and content quality becomes clearer when you see how each signal is weighted.
What the research actually says about page speed and SEO rankings
The research on page speed and rankings tells a consistent story, and it is more nuanced than most guides admit. Speed acts as a gatekeeper, not a growth lever. Severe failures hurt. Passing “good” removes the penalty. Going from “good” to “excellent” produces no measurable ranking benefit.
The March 2026 core update made this more concrete. Sites with higher INP values experienced measurable ranking drops after the update, with larger delays leading to bigger position declines. Those are real, measurable penalties for failing a specific threshold, not vague correlations.
What the research does not show is any benefit to pushing past “good.” When a site moves from a “Good” LCP of 2.4 seconds down to 1.2 seconds, ranking change is typically zero. The threshold is what matters for SEO, not the score.
Key research findings and expert perspectives:
- Content quality dominates. Content quality is the top Google ranking factor, followed by keyword relevance and backlinks. Page speed sits inside the technical SEO cluster, not at the top of the rankings pyramid. A fast, empty page will not outrank a well-written, authoritative page that loads in 2.2 seconds.
- CrUX drives ranking decisions, not Lighthouse. Danny Sullivan (Google Search Liaison) confirmed in April 2023 that page experience is not a standalone ranking system. It feeds into multiple core ranking systems alongside content quality, links, and relevance.
- Failing compounds other weaknesses. John Mueller (Google Search Advocate) has noted that poor Core Web Vitals alone are unlikely to cause a large ranking drop. But combined with other weaknesses, poor speed adds a negative signal to an already struggling page, making recovery harder.
- Pages with good CWV show higher ranking rates. Pages that pass all three Core Web Vitals thresholds tend to rank better, appearing more often in top positions compared to those that do not.
- Conversion ROI often exceeds SEO ROI. Speed improvements deliver more tangible returns through increased conversion rates than through direct ranking gains, making the business case for performance work stronger on the revenue side.
- Mobile speed is more critical. Since Google uses mobile-first indexing and most searches happen on mobile, failing Core Web Vitals on mobile has a larger ranking impact than failing on desktop.
- Origin-level fallback amplifies risk. When a high-traffic page drags down origin-level CrUX scores, low-traffic pages across the entire site can lose ranking strength even if those individual pages are fast.
- INP is the new frontier. INP replaced FID in March 2024 and became a primary ranking signal in March 2026. It is harder to pass than FID was, and it requires architectural JavaScript changes rather than simple asset optimizations.
The practical implication for resource allocation: get Core Web Vitals to “good” as quickly as possible, then redirect your budget to content quality and backlinks. Those two factors will always have a larger ranking impact than pushing speed metrics from “good” to “excellent.” For SEO quick wins that complement speed improvements, combining technical fixes with content strategy tends to produce the fastest measurable gains.
If your site does not have enough traffic to appear in CrUX (roughly 1,000 or more monthly page views in Chrome), Core Web Vitals will not factor into your rankings at all. In that case, focus on content and authority first. Page speed becomes relevant once you have the traffic volume for Google to measure it.
Using Google Search Console effectively to monitor your Core Web Vitals field data is the single most important habit you can build for ongoing page speed management. The data is already there. The question is whether you act on it.
Key Takeaways
Page speed affects Google rankings as a confirmed but lightweight signal that primarily removes penalties for failing Core Web Vitals thresholds, with content quality, backlinks, and relevance remaining the dominant ranking factors.
| Point | Details |
|---|---|
| Speed is a gatekeeper, not a growth lever | Passing Core Web Vitals removes ranking penalties; exceeding “good” thresholds produces no measurable SEO boost. |
| CrUX field data drives rankings | Google uses 75th-percentile real user data over 28 days, not Lighthouse lab scores, for ranking decisions. |
| Mobile performance matters most | Mobile-first indexing means mobile Core Web Vitals failures hurt rankings across all devices, not just mobile. |
| INP is the hardest and newest metric | Sites with failing INP metrics experienced ranking drops after the March 2026 update; fixing it requires JavaScript changes. |
| Conversion ROI often beats SEO ROI | Speed improvements typically deliver stronger returns through higher conversion rates than through direct ranking gains. |
Ranksector publishes daily SEO-optimized content for B2B SaaS companies, combining keyword research and a backlink exchange system to grow domain authority without manual effort. If technical SEO is eating your team’s time, the Ranksector AI audit identifies page speed issues and content gaps in one pass, and the agency platform handles ongoing publication so your team can focus on strategy.
Recommended
- How Search Engines Rank Websites: 2026 Guide · Ranksector Blog — Ranksector
- Types of SEO Quick Wins for Faster Rankings in 2026 · Ranksector Blog — Ranksector
- Why Ranking on Page One Matters in 2026 · Ranksector Blog — Ranksector
- Why Domain Rating Affects Rankings: 2026 SEO Guide · Ranksector Blog — Ranksector