
Keyword Opportunity Score: What It Is and How to Use It
A Keyword Opportunity Score is a composite metric that weighs search demand, ranking difficulty, your current position, and commercial intent together to show which keywords offer the most realistic upside for your site. If you want one immediate action: open Google Search Console right now and filter your queries to positions 4–15. Those are your highest-probability wins.
- Pull your GSC query report and sort by position, filtering for ranks 4–15
- Cross-reference those queries against a CTR curve (position 1 captures roughly 10x the clicks of position 10 on most SERPs)
- Flag any query where volume justifies a push and difficulty does not prohibit it
That three-step audit takes under an hour and surfaces more genuine opportunity than most discovery tools will in a week.
Table of Contents
- What does a keyword opportunity score actually measure?
- What inputs go into the score and how do you calculate it?
- How do you read the score and set useful thresholds?
- A practical workflow for turning scores into SEO priorities
- Which tools surface opportunity scores and how do they differ?
- A worked numeric example you can copy into a spreadsheet
- How to track opportunity scores over time
- Automate the inputs so you can focus on decisions
- Key Takeaways
- The mistake most teams make with opportunity scoring
- Useful sources and where to get your inputs
What does a keyword opportunity score actually measure?
Most SEO teams default to two numbers: search volume and keyword difficulty. Volume tells you how much demand exists; difficulty tells you how hard the competition is. Neither one alone tells you whether your site, at its current position, should prioritize a keyword today.
A keyword opportunity score solves that by combining both into a single prioritization signal. Klipfolio documents this as a KPI that compares your current rankings to estimated search traffic to identify where improvement potential is highest. The shift in thinking is significant: instead of asking “which keyword has the most volume?” you ask “which keyword gives us the best realistic return on optimization effort?”
The core insight: A keyword ranking at position 8 with moderate difficulty and solid volume is often a better bet than a position-30 keyword with massive volume and brutal competition. Opportunity scoring makes that comparison explicit and repeatable.
FindKW frames this as the intersection of demand, feasibility, intent fit, and business value. That framing is more complete than a simple volume/difficulty ratio, and it is the direction most serious SEO teams are moving.
What inputs go into the score and how do you calculate it?
Standard inputs
Every credible opportunity score model draws from the same core variables:
- Search volume: — Monthly average queries, typically from Google Keyword Planner or a third-party data provider
SERPTracking’s keyword opportunity analyzer combines rank position, search demand, ranking spread, and page-level performance to surface realistic upside rather than raw discovery ideas. That combination is closer to what a well-built custom model should do.
Formula variants
Formula 1: Simple ratio
Opportunity Score = Volume / (Difficulty + 1)
This is the fastest version to build. Divide volume by difficulty (add 1 to avoid division by zero). Normalize the result to a 0–100 scale by dividing each score by the maximum score in your dataset. Twaino describes this approach as a normalized 0–100 value that supports prioritization without replacing editorial judgment.
Formula 2: Ulwick-style gap model
Opportunity Score = Importance + max(Importance − Satisfaction, 0)
Borrowed from Ulwick’s Outcome-Driven Innovation framework, this maps search volume to “importance” and SERP satisfaction (how well current results serve the query) to “satisfaction.” HM Digital Solution documents this approach with weighted multi-variable options for more accurate scoring. A keyword that is heavily searched but poorly served by existing content scores very high.
Formula 3: Weighted multi-variable model
Score = (w1 × Volume_norm) + (w2 × (100 − KD_norm)) + (w3 × RankGap_norm) + (w4 × CPC_norm)
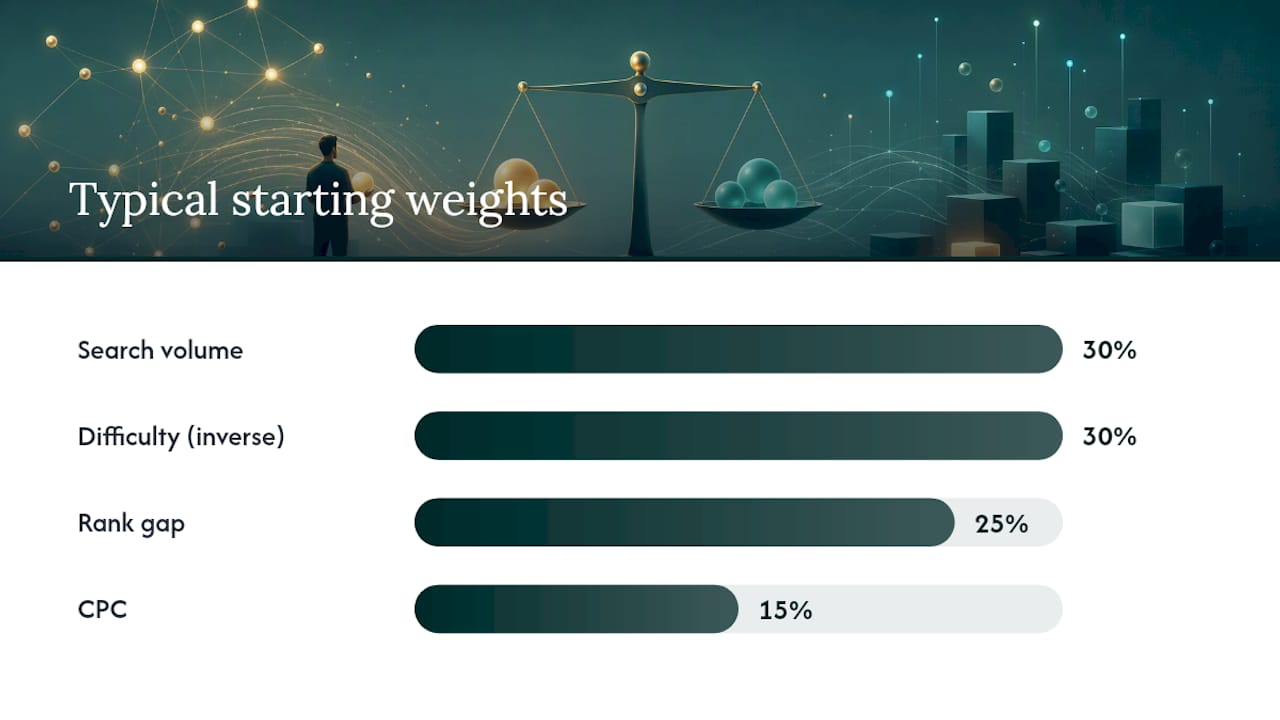
Normalize each variable to 0–100, then apply weights that reflect your campaign priorities. A typical starting weight distribution: volume 30%, difficulty inverse 30%, rank gap 25%, CPC 15%. Adjust based on your site’s authority and business goals.
| Input | Source | Normalization |
|---|---|---|
| Search volume | Google Keyword Planner, GSC impressions | Divide by max volume in set × 100 |
| Keyword difficulty | Third-party rank tracker | Use as-is (0–100) |
| Current rank | GSC average position, rank tracker | (100 − rank) / 100 × 100 |
| CPC | Google Ads Keyword Planner | Divide by max CPC in set × 100 |
| Intent fit | Manual or tool-assisted classification | Binary or 0–50–100 scale |
Stated assumptions: CTR curves vary by SERP type (branded, local, informational). Position-to-traffic mapping assumes a standard organic CTR distribution. Volume figures from Keyword Planner are monthly averages and may lag seasonal trends by 1–2 months.
Pro Tip: When you normalize, always normalize within a topic cluster or campaign, not across your entire keyword universe. A volume of 500 is high for a niche B2B term and low for a consumer term. Mixing them distorts the score.
How do you read the score and set useful thresholds?
RespectASO documents a 0–100 opportunity score that applies a non-linear difficulty penalty and uses four defined bands. That banding logic translates directly to SEO keyword work:
| Score band | Label | Recommended action |
|---|---|---|
| High | Excellent | Prioritize immediately; assign content or optimization task this sprint |
| Medium-high | Good | Queue for next cycle; confirm intent fit before committing |
| Medium | Moderate | Monitor; revisit if authority grows or competition drops |
| Low | Avoid | Deprioritize; effort cost exceeds realistic traffic return |
These thresholds are starting points, not absolutes. A site with a domain rating above 60 can realistically target keywords that a newer site should classify as “Moderate.” Conversely, a brand-new B2B SaaS site should treat a score of 60 as “Good” only if the difficulty is genuinely low.
One important adjustment: always layer business value on top of the score before final prioritization. A keyword scoring 55 that maps directly to a product page is worth more than a keyword scoring 70 that maps to a top-of-funnel blog post with no conversion path. Google Ads documentation reinforces this, noting that keyword-level metrics should be paired with landing page relevance and experience when evaluating opportunity.
Pro Tip: Set your thresholds in a shared spreadsheet with a notes column. When you adjust weights after an algorithm update, you can see how the same keyword’s score changed and why, which builds team trust in the model.
A practical workflow for turning scores into SEO priorities
This process moves you from a raw keyword list to a scored, clustered shortlist your team can act on.
-
Collect your raw list. Pull queries from GSC (filter: last 90 days, all positions), add discovery keywords from Keyword Planner, and include any competitor gap terms from your rank tracker.
-
Gather inputs for each keyword. For every term, record: average monthly volume, keyword difficulty, current average position, estimated CPC, and a manual intent classification (informational, commercial, transactional, navigational).
-
Normalize each variable. Scale all inputs to 0–100 within your dataset. Use the formulas in the table above.
-
Apply weights and calculate scores. Use the weighted multi-variable formula. Start with the default weights (volume 30%, difficulty inverse 30%, rank gap 25%, CPC 15%) and adjust after your first review cycle.
-
Sort and filter. Sort descending by score. Filter out any keyword where intent fit is zero (the content type does not match what you can produce or what your site covers).
-
Cluster by page or topic. Group keywords that share the same target URL or topic. Score the cluster as a unit, not just individual terms. FindKW recommends this cluster-level scoring because it prevents you from creating redundant pages for near-identical queries.
-
Apply the rank-gap rule. Keywords where you already rank between positions 4 and 15 get a priority flag. These terms need smaller optimizations to capture significantly more traffic, and they often convert faster than brand-new targets. For practical tactics on moving these terms, see SEO quick wins for faster rankings.
-
Run a pre-action checklist before optimizing. For each flagged keyword, confirm: the target page exists and is indexed, internal links point to it from relevant pages, the title tag and H1 include the keyword naturally, and there are no technical issues (crawl errors, slow load, thin content) blocking the page.
-
Assign and publish. Move top-scoring clusters into your content calendar or optimization queue with a clear owner and deadline.
Which tools surface opportunity scores and how do they differ?
Three categories of tools are worth knowing.
Rank-tracking and analyzer tools pull live position data and combine it with volume and difficulty to produce a score automatically. SERPTracking’s analyzer is one example that surfaces rank position, search demand, and page-level performance together. These tools are fast but often opaque about their weighting.
KPI dashboard tools like Klipfolio let you build a custom Keyword Opportunity KPI by connecting GSC and rank-tracking data sources. You define the formula, which means you control the weights. The tradeoff is setup time.
Standalone calculators like Twaino’s free tool and Sorank’s opportunity scoring feature let you input a keyword and get a quick normalized score without building a full model. These are useful for spot-checking individual terms or validating your spreadsheet model against a second source.
Watch for this: Tools that do not disclose their formula inputs or weighting are a risk. If a tool gives you a score of 72 but cannot tell you whether that reflects volume, difficulty, or rank proximity, you cannot trust it for prioritization decisions. Demand transparency before you build a workflow around any proprietary score.
For U.S.-focused teams, the most reliable input sources are Google Search Console (queries, impressions, average position, CTR), Google Keyword Planner (volume, CPC), and a rank tracker of your choice for daily or weekly position monitoring. Indexly offers keyword tracking with opportunity-oriented reporting, and Sorank surfaces opportunity scores alongside rank movement data.
Pro Tip: If you are on a tight budget, a Google Sheets model fed by GSC exports and Keyword Planner data gives you a fully transparent, customizable score at zero cost. Pair it with advanced SEO techniques to act on what you find.
A worked numeric example you can copy into a spreadsheet
Here are three example keywords run through the weighted multi-variable model.
Step 1: Raw inputs
| Keyword | Volume | Difficulty | Current rank | CPC |
|---|---|---|---|---|
| project management SaaS | significant monthly searches | moderate difficulty | rank in low double digits | relatively high CPC |
| team task tracker | moderate monthly searches | moderate difficulty | top 10 rank | moderate CPC |
| free project planner | higher monthly searches | higher difficulty | rank beyond top 30 | lower CPC |
Step 2: Normalize to 0–100 within this dataset
| Keyword | Volume_norm | KD_inv_norm | RankGap_norm | CPC_norm |
|---|---|---|---|---|
| project management SaaS | — | — | — | 100 |
| free project planner | 100 | — | — | — |
RankGap_norm = (100 − rank) / 100 × 100, then normalized within the set. KD_inv_norm = (100 − KD), normalized.
Step 3: Apply weights and calculate final score
Score = (0.30 × Volume_norm) + (0.30 × KD_inv_norm) + (0.25 × RankGap_norm) + (0.15 × CPC_norm)
| Keyword | Final score | Band |
|---|---|---|
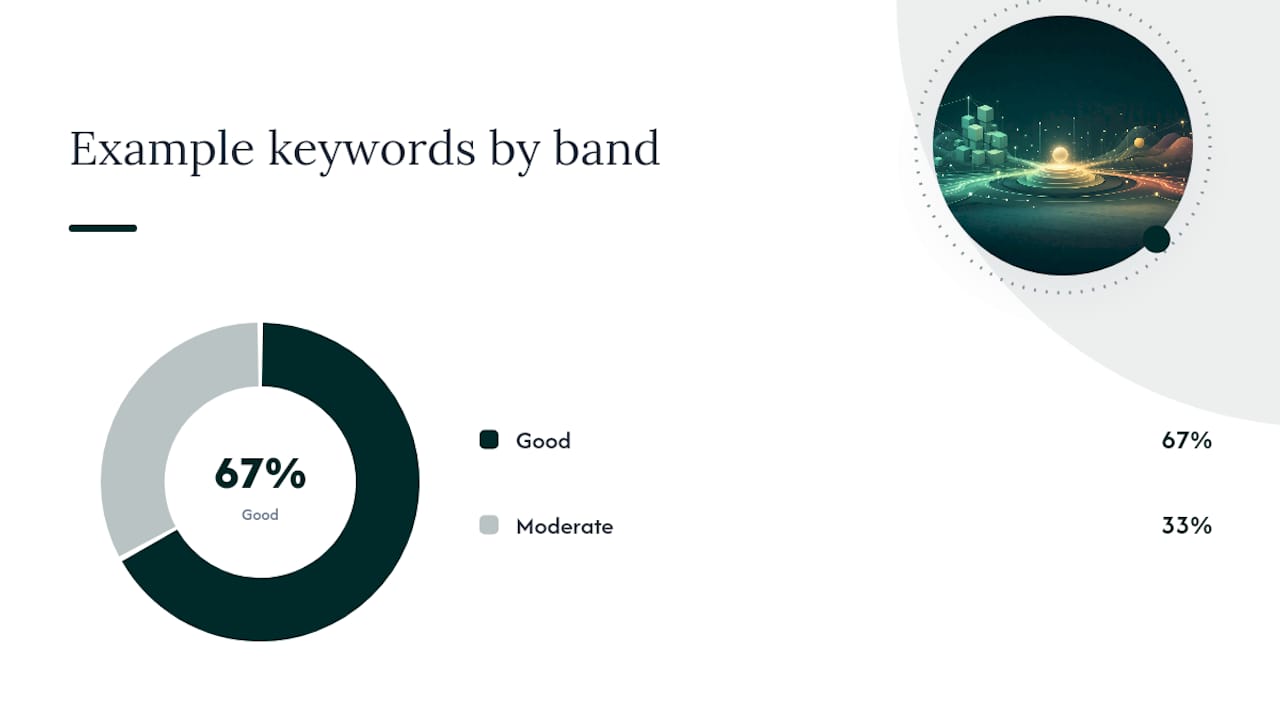
| project management SaaS | — | Good |
| team task tracker | — | Good |
| free project planner | — | Moderate |
“Team task tracker” edges out “project management SaaS” despite lower volume because its difficulty is significantly lower and the rank gap is tighter. “Free project planner” looks attractive on volume alone but scores Moderate because the rank gap is large and CPC is low, signaling weak commercial intent.
Spreadsheet formula (Google Sheets):
Assuming Volume_norm is in column B, KD_inv_norm in C, RankGap_norm in D, CPC_norm in E:
=(0.30*B2)+(0.30*C2)+(0.25*D2)+(0.15*E2)
Data sources for each input:
- Volume: Google Keyword Planner (monthly averages)
- Keyword difficulty: your rank tracker (Ahrefs KD, Semrush KD, or equivalent)
- Current rank: GSC average position or daily rank tracker export
- CPC: Google Ads Keyword Planner, CPC column
For a deeper guide on building this kind of scoring framework, the keyword opportunity identification guide on the Ranksector blog walks through the full process with B2B SaaS examples.
How to track opportunity scores over time
A score calculated once is a snapshot. A score tracked weekly or monthly becomes a decision-making tool.
Recommended cadence:
- Weekly: For keywords in active optimization campaigns (positions 4–15 targets, recently published content)
- Monthly: For discovery and monitoring (positions 16–30, new topic clusters under consideration)
Integration checklist:
- Connect GSC to your dashboard (Klipfolio, Looker Studio, or a Google Sheets pipeline)
- Pull rank tracker data on the same cadence as your score refresh
- Keep a source-of-truth spreadsheet where raw inputs, normalized values, and final scores are versioned by date
- Flag any keyword where the score drops by more than 10 points between cycles; that usually signals a competitor content surge or a ranking drop worth investigating
Companion metrics to report alongside the score:
Klipfolio’s keyword performance guidance is clear on this: ranking alone does not tell you whether SEO is working. Report these alongside your opportunity score:
- Organic traffic to the target page
- CTR from GSC (impressions vs. clicks)
- Goal completions or conversions attributed to organic
- Impressions trend (rising impressions with flat CTR often means a ranking improvement is close)
- Ranking distribution (how many keywords rank in positions 1–3, 4–10, 11–20)
For SEO monitoring tips that complement this reporting setup, Brainiac Media’s process guidance covers the operational side of tracking cadence well.
Automate the inputs so you can focus on decisions
Pulling GSC data, normalizing variables, and refreshing scores manually every week is the part of this workflow that kills momentum for small teams. Ranksector’s analytics dashboard connects directly to Google Search Console and surfaces rank-tracking data in one place, so the inputs for your scoring model are always current without manual exports. The platform also flags pages with optimization potential based on rank proximity, which maps directly to the positions 4–15 rule at the core of opportunity scoring.
If you want to see how it works before committing, the Ranksector free tools page is the fastest entry point. For teams that also need automated content publishing to act on their scored keyword list, the AI audit tool surfaces page-level issues that feed directly into the pre-action checklist.
Key Takeaways
A keyword opportunity score is only as useful as the workflow built around it: collect reliable inputs, normalize within your topic cluster, weight by campaign priority, and act on positions 4–15 first.
| Point | Details |
|---|---|
| Use a composite score | Volume and difficulty alone miss rank proximity and intent; a weighted model gives more accurate prioritization. |
| Focus on positions 4–15 | Keywords already ranking in this band need smaller optimizations and convert faster than cold targets. |
| Score at the cluster level | Group near-identical queries by target URL before scoring to avoid creating redundant pages. |
| Layer business value last | A moderate-scoring keyword on a product page often outranks a high-scoring informational term in real ROI. |
| Refresh scores regularly | Re-weight variables after major algorithm updates or competitor content surges to keep prioritization accurate. |
The mistake most teams make with opportunity scoring
The biggest error is treating the score as a verdict rather than a starting point. Teams build a model, sort descending, and assign content work to the top 20 keywords without checking whether those keywords actually align with pages they can improve, content types they can produce, or conversion paths that exist on their site.
Volume bias is the second problem. When you weight volume at 50% or higher, the model consistently surfaces high-competition head terms that look great on a spreadsheet and perform poorly in practice. A 30% volume weight, balanced against rank gap and difficulty, produces a list that is less exciting and far more executable.
The third issue is trusting proprietary tool scores without inspecting the inputs. If a tool tells you a keyword scores 81 but does not show you whether that reflects your site’s current rank, a generic difficulty estimate, or a volume figure from two years ago, you are optimizing against a black box. The RespectASO opportunity score documentation is one of the few public examples that discloses its non-linear difficulty penalty and banding logic. That kind of transparency is what you should demand from any tool you build a workflow around.
For small B2B SaaS teams specifically: prioritize page-level wins over one-off keyword pages. One well-optimized page that ranks for a cluster of 8–12 related terms will consistently outperform eight thin pages each targeting a single keyword. Score the cluster, optimize the page, and measure the aggregate traffic lift. That is where the real gains are.
Useful sources and where to get your inputs
- Keyword Opportunity - Improve Search Rankings
- Keyword Performance measures and guidance
- Keyword Opportunity Analyzer - SERP Tracking
- Opportunity Score — ASO Glossary — RespectASO
- Keyword Opportunity Score | Free - Twaino
- Keyword Opportunity Score: Calculate & Find SEO Opportunities
- Quality Score and keyword performance — Google Ads Support
- Keyword Opportunity Scoring - FindKW
Recommended
- Keyword Opportunity Identification Guide for SEO Pros · Ranksector Blog — Ranksector
- Keyword Gap Analysis: What SEO Specialists Need to Know · Ranksector Blog — Ranksector
- Why Keyword Intent Matters in Competitive SEO · Ranksector Blog · Ranksector
- How to Find Keyword Gaps Competitors Miss: A SaaS SEO Workflow · Ranksector Blog — Ranksector