
6 Step Editor Workflow for SEO Content Analytics and Daily Publishing
SEO content analytics is the practice of measuring how individual pieces of content perform against business goals, not just traffic counts. It combines engagement data, search visibility, and conversion signals into one workflow that tells you which articles to fix, expand, or leave alone. Done right, it replaces guesswork with a prioritized list of what to write, update, or kill next.
TL;DR:
- Content performance metrics should focus on engagement, search visibility, and conversions rather than traffic volume alone.
- Metrics like engaged time, scroll depth, impressions, clicks, and content-assisted conversions predict actual business outcomes better than vanity stats.
- Dashboards must provide real-time or near-real-time data with integration to content management systems and automated tagging for effective action.
- Prioritization requires setting clear goals, tracking a few relevant KPIs, and automatically surfacing content opportunities or issues.
- Combining analytics with technical SEO, link building, and paid strategies ensures insights lead to measurable results.
Table of Contents
- What Makes SEO Content Analytics Different From a Content Audit
- Which Metrics Actually Predict Content Performance
- What to Look for in a Content Analytics Dashboard
- Turning Analysis Into Prioritized Editorial Work
- AI Visibility and Semantic Coverage: The Signals Most Teams Miss
- How Ranksector Uses Analytics to Prioritize Daily Publishing
- Real Examples of Analytics Driving Content Decisions
- Fitting Content Analytics Into the Bigger SEO Picture
- Author’s Weekly Content-Analytics Checklist
- Let Ranksector Handle the Publishing While You Read the Data
- Sources
- FAQ
What Makes SEO Content Analytics Different From a Content Audit
A content audit inventories what you have and cleans up what’s broken: duplicate pages, thin content, outdated stats. SEO content analytics is a different job. It measures whether content is contributing to outcomes the business actually cares about, and it runs continuously rather than as a one-time cleanup project.
Mailchimp draws this distinction clearly: audits organize your library, while performance analysis measures content’s contribution to goals like leads, trials, or revenue. You can’t skip the second step by doing more of the first. A perfectly organized content library still fails you if nobody has defined what “working” means in business terms.
That definition step trips up more teams than any tooling decision. Before picking a single metric, decide what content success looks like for your business:
- A demo request or trial signup, if you sell SaaS
- A newsletter subscription, if content feeds a nurture funnel
- Assisted conversions across a multi-touch buyer journey
- Organic visibility gains for terms your sales team already closes deals on
Skip this step and you’ll end up reporting on page views because they’re easy to pull, not because they predict revenue. That’s the core trap: vanity metrics feel like progress because they always go up. A content audit approach answers “is this page technically sound?” SEO content analytics answers “is this page earning its keep?” Both matter, but they’re not the same question, and conflating them is why so many content teams can’t explain their own results to leadership.
Which Metrics Actually Predict Content Performance
Most teams track too many numbers and act on none of them. The fix isn’t more data, it’s fewer metrics tied directly to outcomes. Semrush’s content framework groups the useful ones into three buckets, and Semrush’s own list runs to 16 distinct content metrics across engagement, visibility, and conversion. Here’s the shortlist that matters for most editorial teams.
Engagement metrics tell you whether people who land on a page actually read it. Engaged time (not raw time on page) and scroll depth are the two worth watching, along with recirculation rate, which tracks how often a page sends readers to another page on your site instead of back to the search results.
SEO visibility metrics cover impressions, clicks, average position, and increasingly, AI visibility: whether your content gets cited or summarized in AI-generated answers. These come straight from Google Search Console and third-party rank trackers.
Conversion metrics connect content to revenue: content-assisted conversions, demo requests originating from a blog post, or newsletter signups tied to a specific article. Attribution here is never perfectly clean, since most buyers touch several pages before converting, but directional trends still matter more than precise dollar figures.
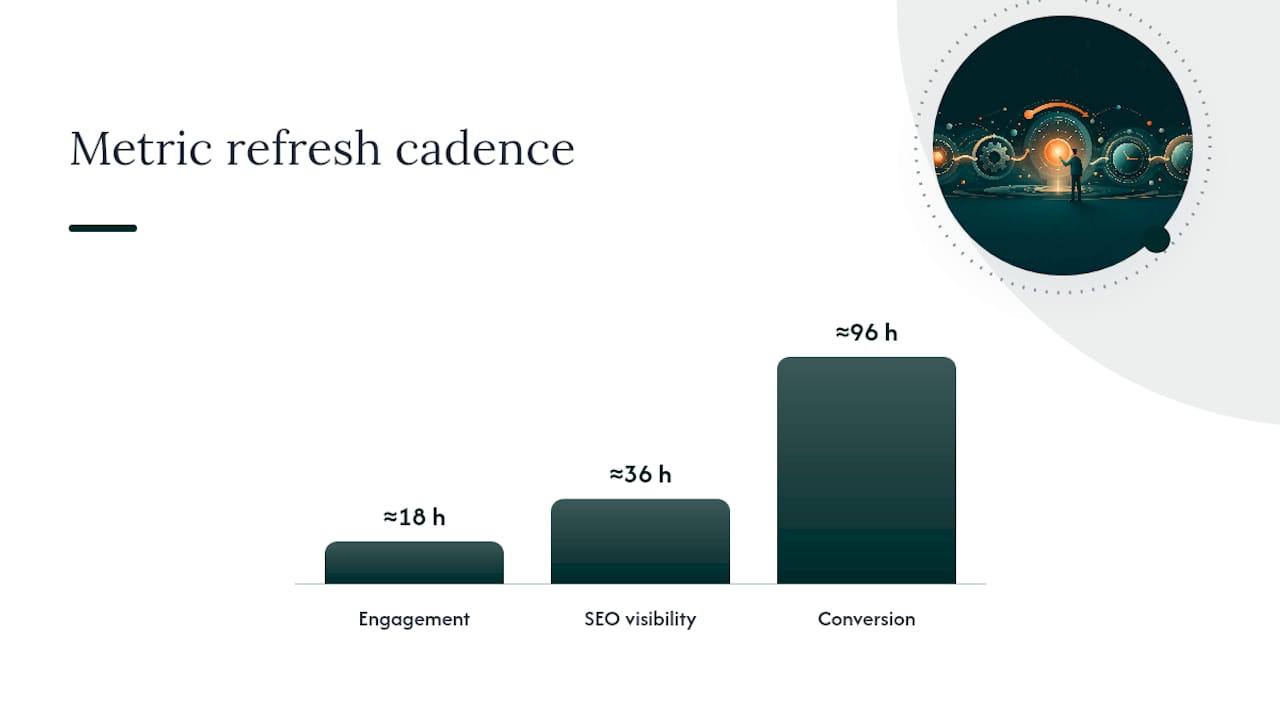
| Metric category | Example metrics | Typical refresh cadence |
|---|---|---|
| Engagement | Engaged time, scroll depth, recirculation | Near-real-time to daily |
| SEO visibility | Impressions, clicks, average position, AI visibility | Daily (Search Console lags 1-2 days) |
| Conversion | Content-assisted conversions, demo requests | Daily to weekly |
Pro Tip: Calculate engaged time per page as total time on page divided by page views, and exclude single-page exit sessions from the average. HubSpot’s methodology does this specifically to avoid inflating your numbers with people who bounced immediately.
Refresh cadence matters more than most dashboards admit. Some platforms update metrics within seconds; others run on cycles with delays of up to two days depending on how data pipes in from Search Console or your CMS. If you’re making same-day editorial calls, know which numbers on your dashboard are live and which are yesterday’s news.
What to Look for in a Content Analytics Dashboard
The best dashboards solve a specific problem: getting performance data in front of the person who can act on it, without a detour through an analyst’s SQL queue. That’s the single-pane-of-glass idea, and it’s less about aesthetics than about who gets access.
Editorial teams and SEO teams want different views of the same data. Writers need to see engagement and early ranking signals while a piece is still fresh enough to edit. SEO and growth teams need longer-horizon position tracking, keyword cannibalization checks, and AI visibility trends across the whole site. A dashboard that only serves one audience forces the other to build workarounds in spreadsheets, which defeats the purpose.
Prioritize these capabilities when evaluating any content analytics dashboard:
- CMS or editor integration so writers see data without leaving their drafting environment
- Automated topic and entity tagging to group content by subject instead of by URL
- Conversion-group tracking that maps specific pages to specific business outcomes
- Anomaly detection that flags sudden engagement drops or traffic spikes automatically
- Google Search Console integration for impressions, clicks, and query-level data
Editor-focused platforms like Parse, pushing near-real-time updates and AI-generated topic tags directly into the workflow so writers act on data without waiting for a report. That’s the direction the category is moving: less passive reporting, more active surfacing of what needs attention today.
Run through this quick checklist before committing to any tool: Does it integrate with your CMS natively, or does it require manual tagging? Does it map conversions to content, or just to landing pages? How often does data actually refresh? And does the interface surface three to five priorities, or does it dump forty metrics on a single screen? That last one is the biggest red flag. A dashboard that overwhelms rather than clarifies isn’t a content analytics tool, it’s a data export with extra steps.
Turning Analysis Into Prioritized Editorial Work
Data without a workflow just becomes a report nobody reads twice. The fix is a repeatable loop that turns numbers into a ranked to-do list every week.
- Set the goal first. Decide what “success” means for this content category, whether that’s trial signups, newsletter growth, or ranking for commercial-intent terms.
- Pick three to five KPIs tied directly to that goal. Resist the urge to track everything just because it’s available.
- Surface opportunities automatically. Look for pages with high impressions but low click-through, or high traffic but shallow conversion, rather than manually scanning spreadsheets.
- Prioritize by impact times effort. A page one position away from page one, targeting a high-intent term, beats a full rewrite of a page ranking on page four.
- Run the update or test. Rewrite the section, fix the headline, expand a thin subtopic, or consolidate two competing pages.
- Measure the outcome against the same KPI you started with, on a fixed schedule rather than an ad hoc check.
A weekly single-pane dashboard should surface the top five movers, good or bad, not a full data dump. Mailchimp’s guidance on avoiding analysis paralysis applies directly here: cap your tracked KPIs to what ties to a business goal, review editorial performance weekly, and save deeper strategic reviews for monthly cycles. Teams that try to review everything daily burn out on reporting and never get to the actual editing.
AI Visibility and Semantic Coverage: The Signals Most Teams Miss
Traditional rank tracking answers one question: where does this page sit for one keyword? This question matters less every year as AI-generated answers pull from multiple sources to build a single response. AI visibility measures whether your content gets cited or referenced inside those answers, and it’s a fundamentally different signal from a blue-link position.
Semantic coverage, sometimes discussed as query fanout, measures how many related questions and follow-up queries a single page actually answers. A page can rank well for its target keyword while still having shallow coverage, meaning it misses the adjacent questions readers, and AI systems, expect it to answer. Tools built around this idea score pages on relevance, structure, and topic breadth, then map those scores to specific rewrite or expansion recommendations.
Adobe’s guidance on this is blunt: stop measuring vanity numbers and start using featurization and anomaly detection to catch what a simple pageview count misses, like a sudden engagement drop tied to a broken image or a competitor outranking you on a subtopic you never covered.
When a page shows low fanout but still holds decent rankings, that’s your signal to expand, not rewrite from scratch. When two pages compete for the same fanout and cannibalize each other’s rankings, consolidate them instead of adding a third.
How Ranksector Uses Analytics to Prioritize Daily Publishing
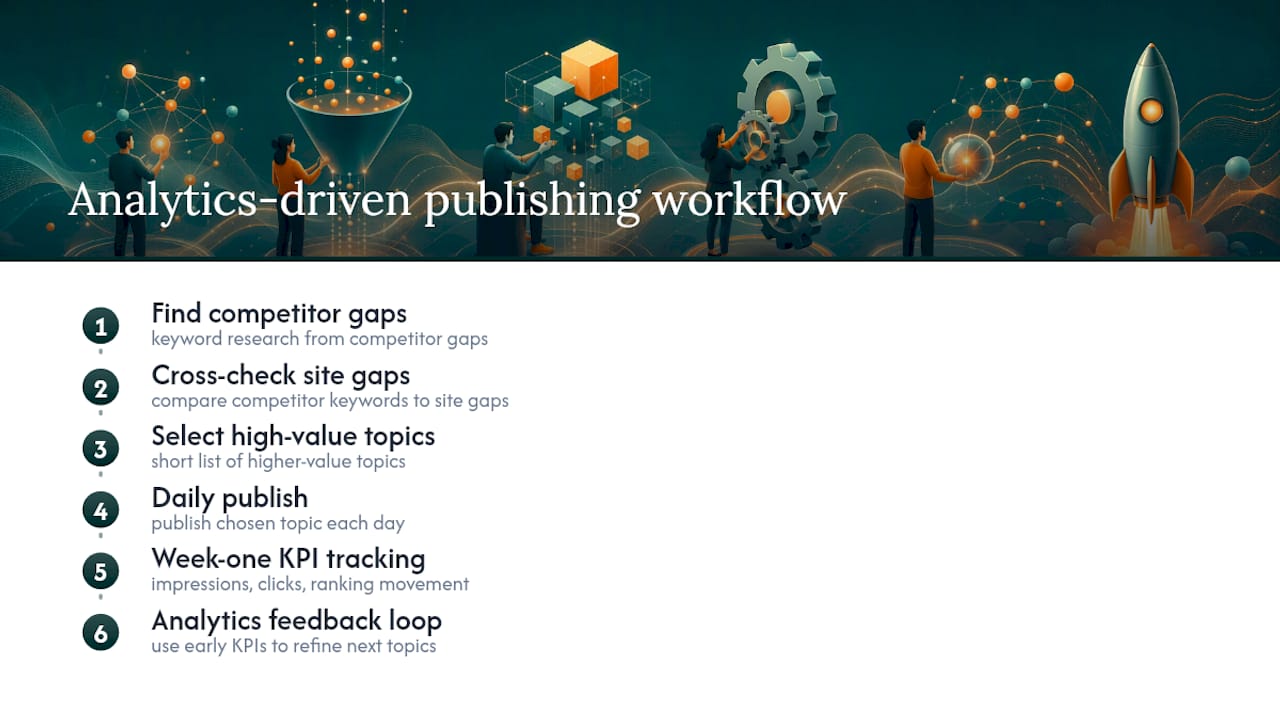
Publishing daily only works if you know which topics deserve that slot. Ranksector’s keyword research pulls from competitor gaps rather than guesswork, and every article it publishes feeds back into an analytics loop that tracks impressions, clicks, and ranking movement from day one.
The practical lesson for any team, automated or manual: alignment beats volume. A content calendar built around what competitors already rank for, cross-checked against what your own site is missing, produces a shorter list of higher-value topics than brainstorming sessions ever do. Track new content against the same KPIs from week one instead of waiting three months to check if it worked. Small teams especially can’t afford to publish blind and find out later.
Real Examples of Analytics Driving Content Decisions
The clearest wins come from teams that stopped treating every published page as finished work. A common pattern: a page ranks on page two for a valuable term, engagement metrics show readers bounce after the intro, and a rewrite focused on answering the query faster moves it into the top five within weeks. That’s a direct product of watching engaged time alongside ranking position instead of either metric alone.
Another recurring case involves cannibalization. Two articles targeting near-identical keywords split ranking signals between them, and neither cracks page one. Consolidating them into a single, more thorough page, redirecting the weaker one, often produces a combined ranking better than either page achieved separately. This only surfaces when a dashboard groups content by topic and entity rather than by individual URL, which is why automated topic tagging matters more than it sounds.
A third pattern shows up in conversion data specifically. A blog post gets healthy traffic but zero assisted conversions, while a lower-traffic post on an adjacent topic drives disproportionate demo requests. Without conversion-group tracking, the high-traffic page looks like the winner. With it, the editorial team redirects effort toward the topic cluster the low-traffic page belongs to, and total demo requests from content rise even as raw traffic stays flat. None of these outcomes required more content. They required better questions asked of the data already sitting in the dashboard.
Fitting Content Analytics Into the Bigger SEO Picture
Content analytics doesn’t operate in isolation. It’s one layer in a stack that includes technical SEO, link building, and paid acquisition, and the handoffs between those layers determine whether insights turn into results.
Technical SEO issues, like slow page speed or crawl errors, distort content metrics before you ever get to judge the writing. A page with excellent copy but a five-second load time will show poor engagement regardless of how well it answers the query, so technical health checks belong upstream of any content analysis. Link building strategy should follow content performance data too: pages already showing strong engagement and conversion signals are better link targets than average-performing pages, because they convert the additional authority into revenue faster.
Paid and organic strategies increasingly share the same content. A page that performs well organically often makes an efficient landing page for paid traffic, since it’s already proven to engage and convert. Content analytics data should feed directly into production planning, informing which topics get expanded resources and which get retired, rather than sitting in a separate reporting silo that marketing leadership checks once a quarter.
Author’s Weekly Content-Analytics Checklist
Check the top five traffic spikes and dips first, then scan for pages with rising impressions but flat clicks. Those title tags need work. Flag any page with a sudden engagement drop for a technical check before assuming the content failed. Run one headline or meta description test per week, never more, so you can actually attribute the result.
— Savannah
Let Ranksector Handle the Publishing While You Read the Data
Building this workflow manually eats the exact time small teams don’t have. Ranksector automates the publishing side, daily, competitor-informed articles, so you can spend your hours on the analytics loop instead of the writing queue.
Every article Ranksector publishes ties back to keyword research built from competitor gaps, not guesswork, which means the content entering your dashboard already targets terms worth tracking. The Pro plan runs $99 per month and includes daily publishing, keyword research, and analytics integration in one subscription. If you want a clearer picture of where your current content stands before adding more, the GEO Audit evaluates your search and AI visibility and flags the gaps worth fixing first. Start with the audit if you’re unsure where the priorities are, or head straight to the Pro plan if you’re ready to put daily publishing on autopilot.
Sources
- Analyze individual content performance (HubSpot Knowledge)
- Parse
- How to Do a Content Performance Analysis | Mailchimp
FAQ
Is SEO Difficult to Learn?
The fundamentals, keyword intent, on-page structure, basic technical checks, are approachable within a few weeks. The analytics side, especially connecting metrics to business outcomes, takes longer because it requires judgment, not just tool knowledge.
What Are the Best Tools for Content Analytics?
Rather than a fixed list, prioritize tools by capability: CMS integration, automated topic tagging, conversion-group tracking, and Google Search Console connectivity matter more than any single brand name. Platforms like Ranksector combine keyword research, publishing, and analytics in one workflow, which reduces the tool-switching that slows most small teams down.
Is SEO Dead Now That AI Answers Search Queries?
No. Search visibility now includes AI-generated answers alongside traditional rankings, which is why AI visibility has become its own tracked metric rather than a replacement for SEO. Content still needs to earn both forms of visibility.
How Do I Learn SEO Content Analytics as a Beginner?
Start by defining one business outcome you want content to drive, then track only the three to five metrics that connect directly to it. Adding tools and dashboards before defining that goal is the most common beginner mistake.
How Much Does Ranksector Cost?
Ranksector’s Pro plan is $99 per month and includes daily publishing, keyword research, and analytics integration. Pricing for the GEO Audit service is available directly on the GEO Audit page.